STRAVA Debate Series #1: The STRAVA Feature That Will Forever Change How You Plan A Ride
- Matthew Chisholm
- February 9, 2022
- Culture
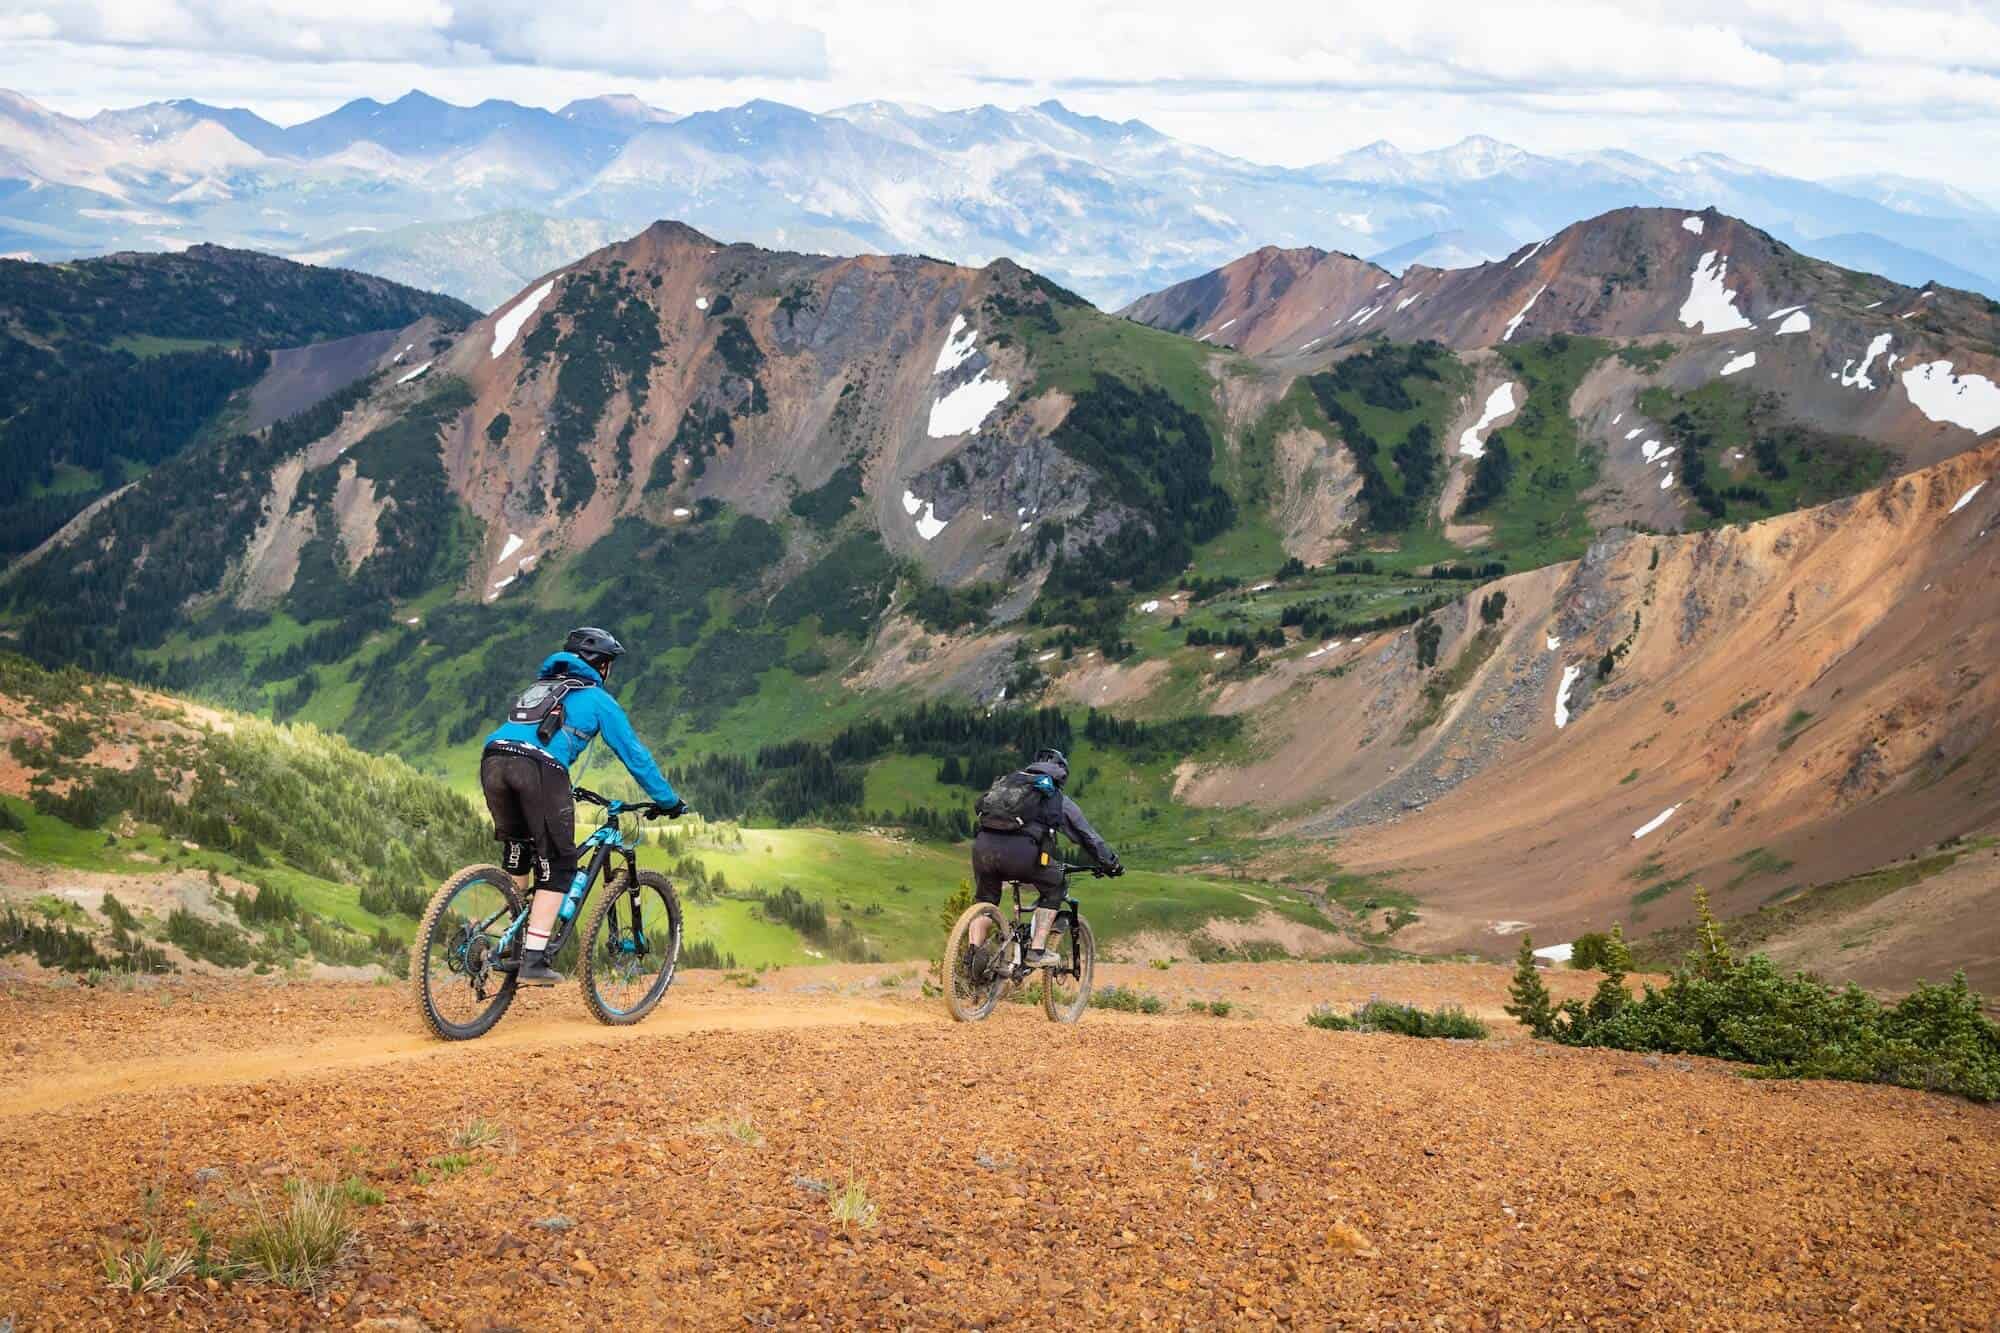
Photo by Greg Rosenke
I can’t think of a topic that is more controversial in mountain biking than the use of STRAVA, the ubiquitous online data tool that tracks and spits out details about every facet of your riding. Some mountain bikers hate it. Others would rather not ride than miss posting on the app’s platform. Like most modern social and data platforms, there are great parts about STRAVA and others that are maddening, if not destructive. This series will seek to explore the hotly debated features, and we’ll start today with the STRAVA Global Heatmap feature.
Digital companies have made data the holy grail of their business strategies, and STRAVA is no different. If you look behind those squiggly orange lines and mile splits, what you’ll see is a company that tracks and displays massive amounts of fitness data for millions of individuals every day. This tracking happens hundreds of thousands of times every hour in every time zone. How truly terrifying! How truly incredible! STRAVA builds its features based on this giant mountain of information, but the most useful (I’d argue) is STRAVA global heatmap.
What's so special about the STRAVA Global Heatmap feature?
What’s so impressive about this feature is that it is a geospatial record of every public run and ride (also ski runs!) ever done on the app and plotted on a sleek, easy to visualize map. That means every road, greenway, trail, or errant hike has been plotted and visualized for you to explore. When I plan a ride, I search online for local riding groups that may link to local trails. Word of mouth also helped, although I found myself eventually tapping out all the most popular routes, thinking to myself, “Is this really it? Are there no more trails?”
STRAVA Global Heatmap is a total game-changer for me. Not only is it helpful in finding local trails that are completely unknown to me, but it helps me to see hidden and/or new trails that aren’t on maps. For example, as I’m planning my ride from home, I try to look up areas close by with squiggly heatmap lines to find out if they show a trail I haven’t been to yet.
I’ve discovered so many incredible local mountain biking parks through this type of research, and many of them are within a 45-minute drive from my house. After looking at the heatmap, I then load up all the segments in the area, click on the leaderboard and see what riders have done on that trail network. Usually, by looking up five different rides, I can find several other route options to serve my goals for the day. It’s an incredibly effective hack that takes minutes to accomplish.
How to use STRAVA Global Heatmap feature.
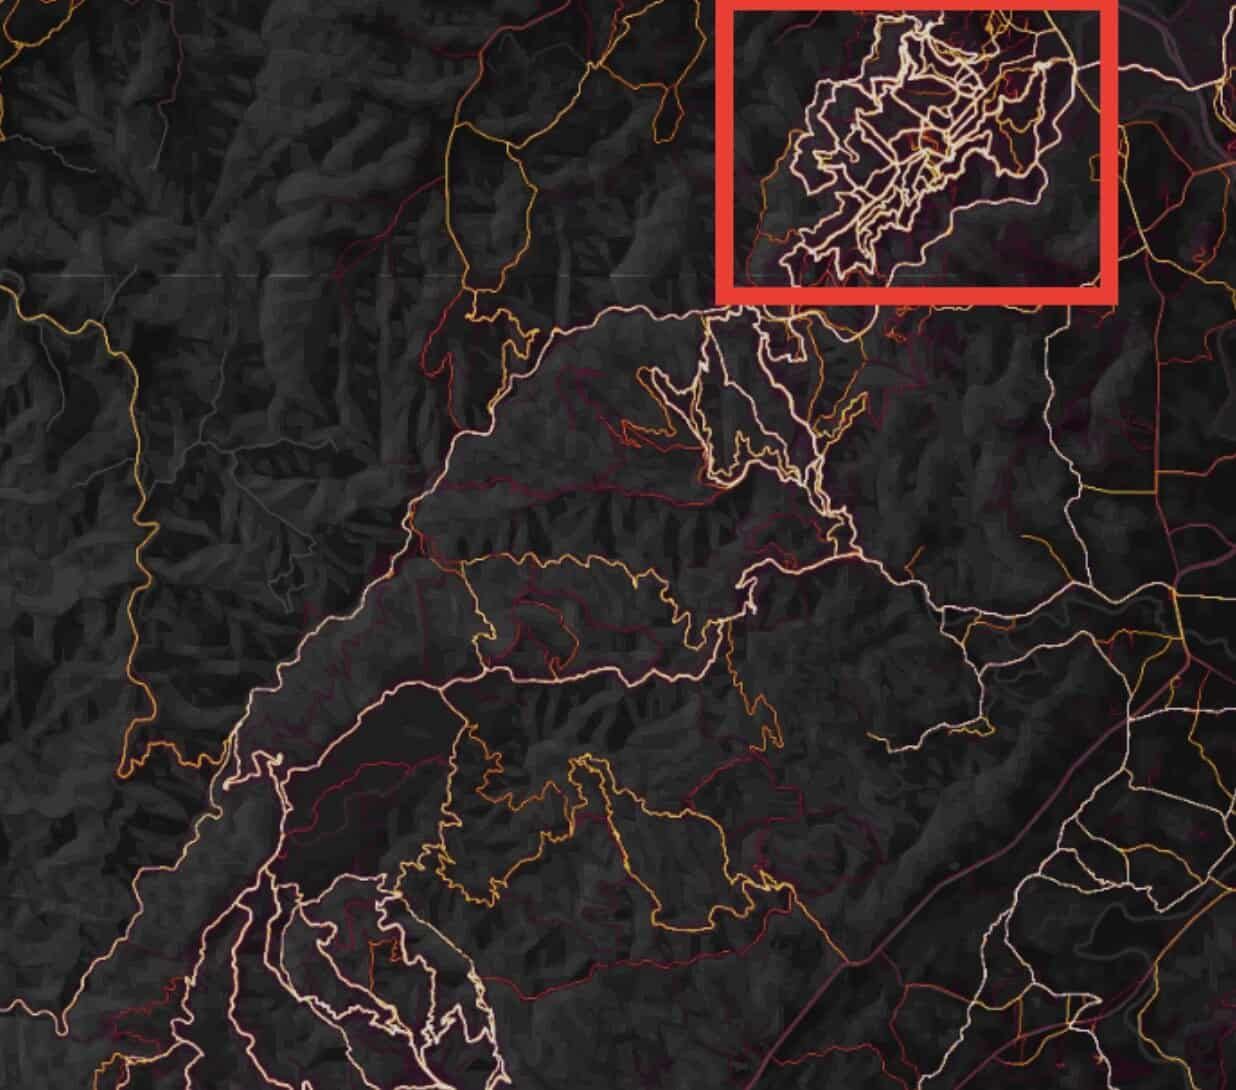
I have used this “trick” extensively in one region in Pisgah National Forest. The heatmap for Pisgah is beautiful but incredibly useful in finding more popular rides and available routes. The map below shows Bent Creek Experimental Forest in the upper right. This part of Pisgah is the busiest area in Pisgah, and I can see all of the trails in bright near-white. But there are also several other trails in orange and red that show new trails or less ridden connectors that could serve up a fantastic unexpected bonus.
The other parts of Pisgah heading towards the southwest are much less dense in terms of trails, and I can see how all the trails connect in various points. I can easily see how to link up several trails for an epic ride. I can also keep in mind trails that only have one exit point in case something goes wrong.
The STRAVA heatmap feature is an incredible tool, but like most STRAVA features, it isn’t essential to have a great ride. For example, sometimes I feel like getting lost on the trail a little bit, not knowing the best way out or back from the trailhead. But if you’re in a time crunch and want to be fully informed, I can’t imagine a better map platform than the global heatmap. As you ride more and more, you will also aggregate a personal heat map (from which STRAVA constructs the global heat map). I view my personal heatmap as a point of pride in my riding and a reminder of how much I’ve been able to do on my bike as well as how much I have left to explore.
Matthew Chisholm
Matt Chisholm is a data analyst and freelance writer who studies the environmental history of the Southern Smoky Mountain region of North Carolina. He was a contributor to Lost in Transition: Removing, Resettling, and Renewing Appalachia and the 2016 edition of the Journal of East Tennessee History, for which he won the 2017 McClung Award. When not writing, Matt enjoys road and mountain biking, hiking, trail running, and drinking beer around Concord, NC where he lives with his wife, daughter, and twin boys.
Get the email for busy mountain bikers.
Discover the best products + gear, and learn about deals from brands you love.
